The latest statistics for the Work Opportunity Tax Credit are from 2018. 2,204,142 total Work Opportunity Tax Credits were issued in the United States in 2018. Over 66% of that was for individuals who had been on SNAP (Food Stamps). Although the value of the issued tax credits would actually vary based on hours worked, and category the employee came in under, we are using the average tax credit value of $2,400. This would give us a potential total value of 2018’s tax credits at a staggering $5,289,940,800.
Any surprises from the statistics?
Texas leads the pack in most categories. This surprised us as Texas is the second largest state by population, estimated at 28.3 million, compared to California’s 39.75 million residents (source).
Which states issued the most WOTC tax credits?
Texas issued 207,513 in 2018 making it the largest issuer of Work Opportunity Tax Credits. California came in second with 158,209, Florida 111,268, Illinois 109,054 and Ohio 102,105 all issued over 100,000 credits throughout 2018.

States that issued the most WOTC tax credits 2018
- Texas 207,513
- California 158,209
- Florida 111,268
- Illinois 109,054
- Ohio 102,105
- Pennsylvania 95,085
- Georgia 87,516
- Michigan 85,062
- Wisconsin 79,533
- Missouri 77,310
Which states issued most denials?
Texas has issued the most denials at 345,390, California coming in second with 259,810 denials. Pennsylvania , Illinois, and Ohio also list over 200,000 denials.
- Texas 345,390
- California 259,810
- Pennsylvania 218,982
- Illinois 208,919
- Ohio 201,122
- Florida 183,117
- Iowa 119,914
- Georgia 117,333
- Missouri 109,495
- Arizona 95,375
Which states are the most caught up and most still pending with WOTC requests?
Ohio currently has the most pending requests at 219,647, and California is a close second with 199,179. Tennessee, Kentucky, Nevada, Connecticut, and New York still have over 100,000 requests pending.
Congratulations to Montana, New Mexico and Rhode Island who do not have any pending requests!
Which states received the most and least requests for WOTC?
Not surprising here, the two states with the highest estimated populations California received the most requests for WOTC at 617,198, and Texas came in at 573,089. Ohio received the third highest requests with 522,874.
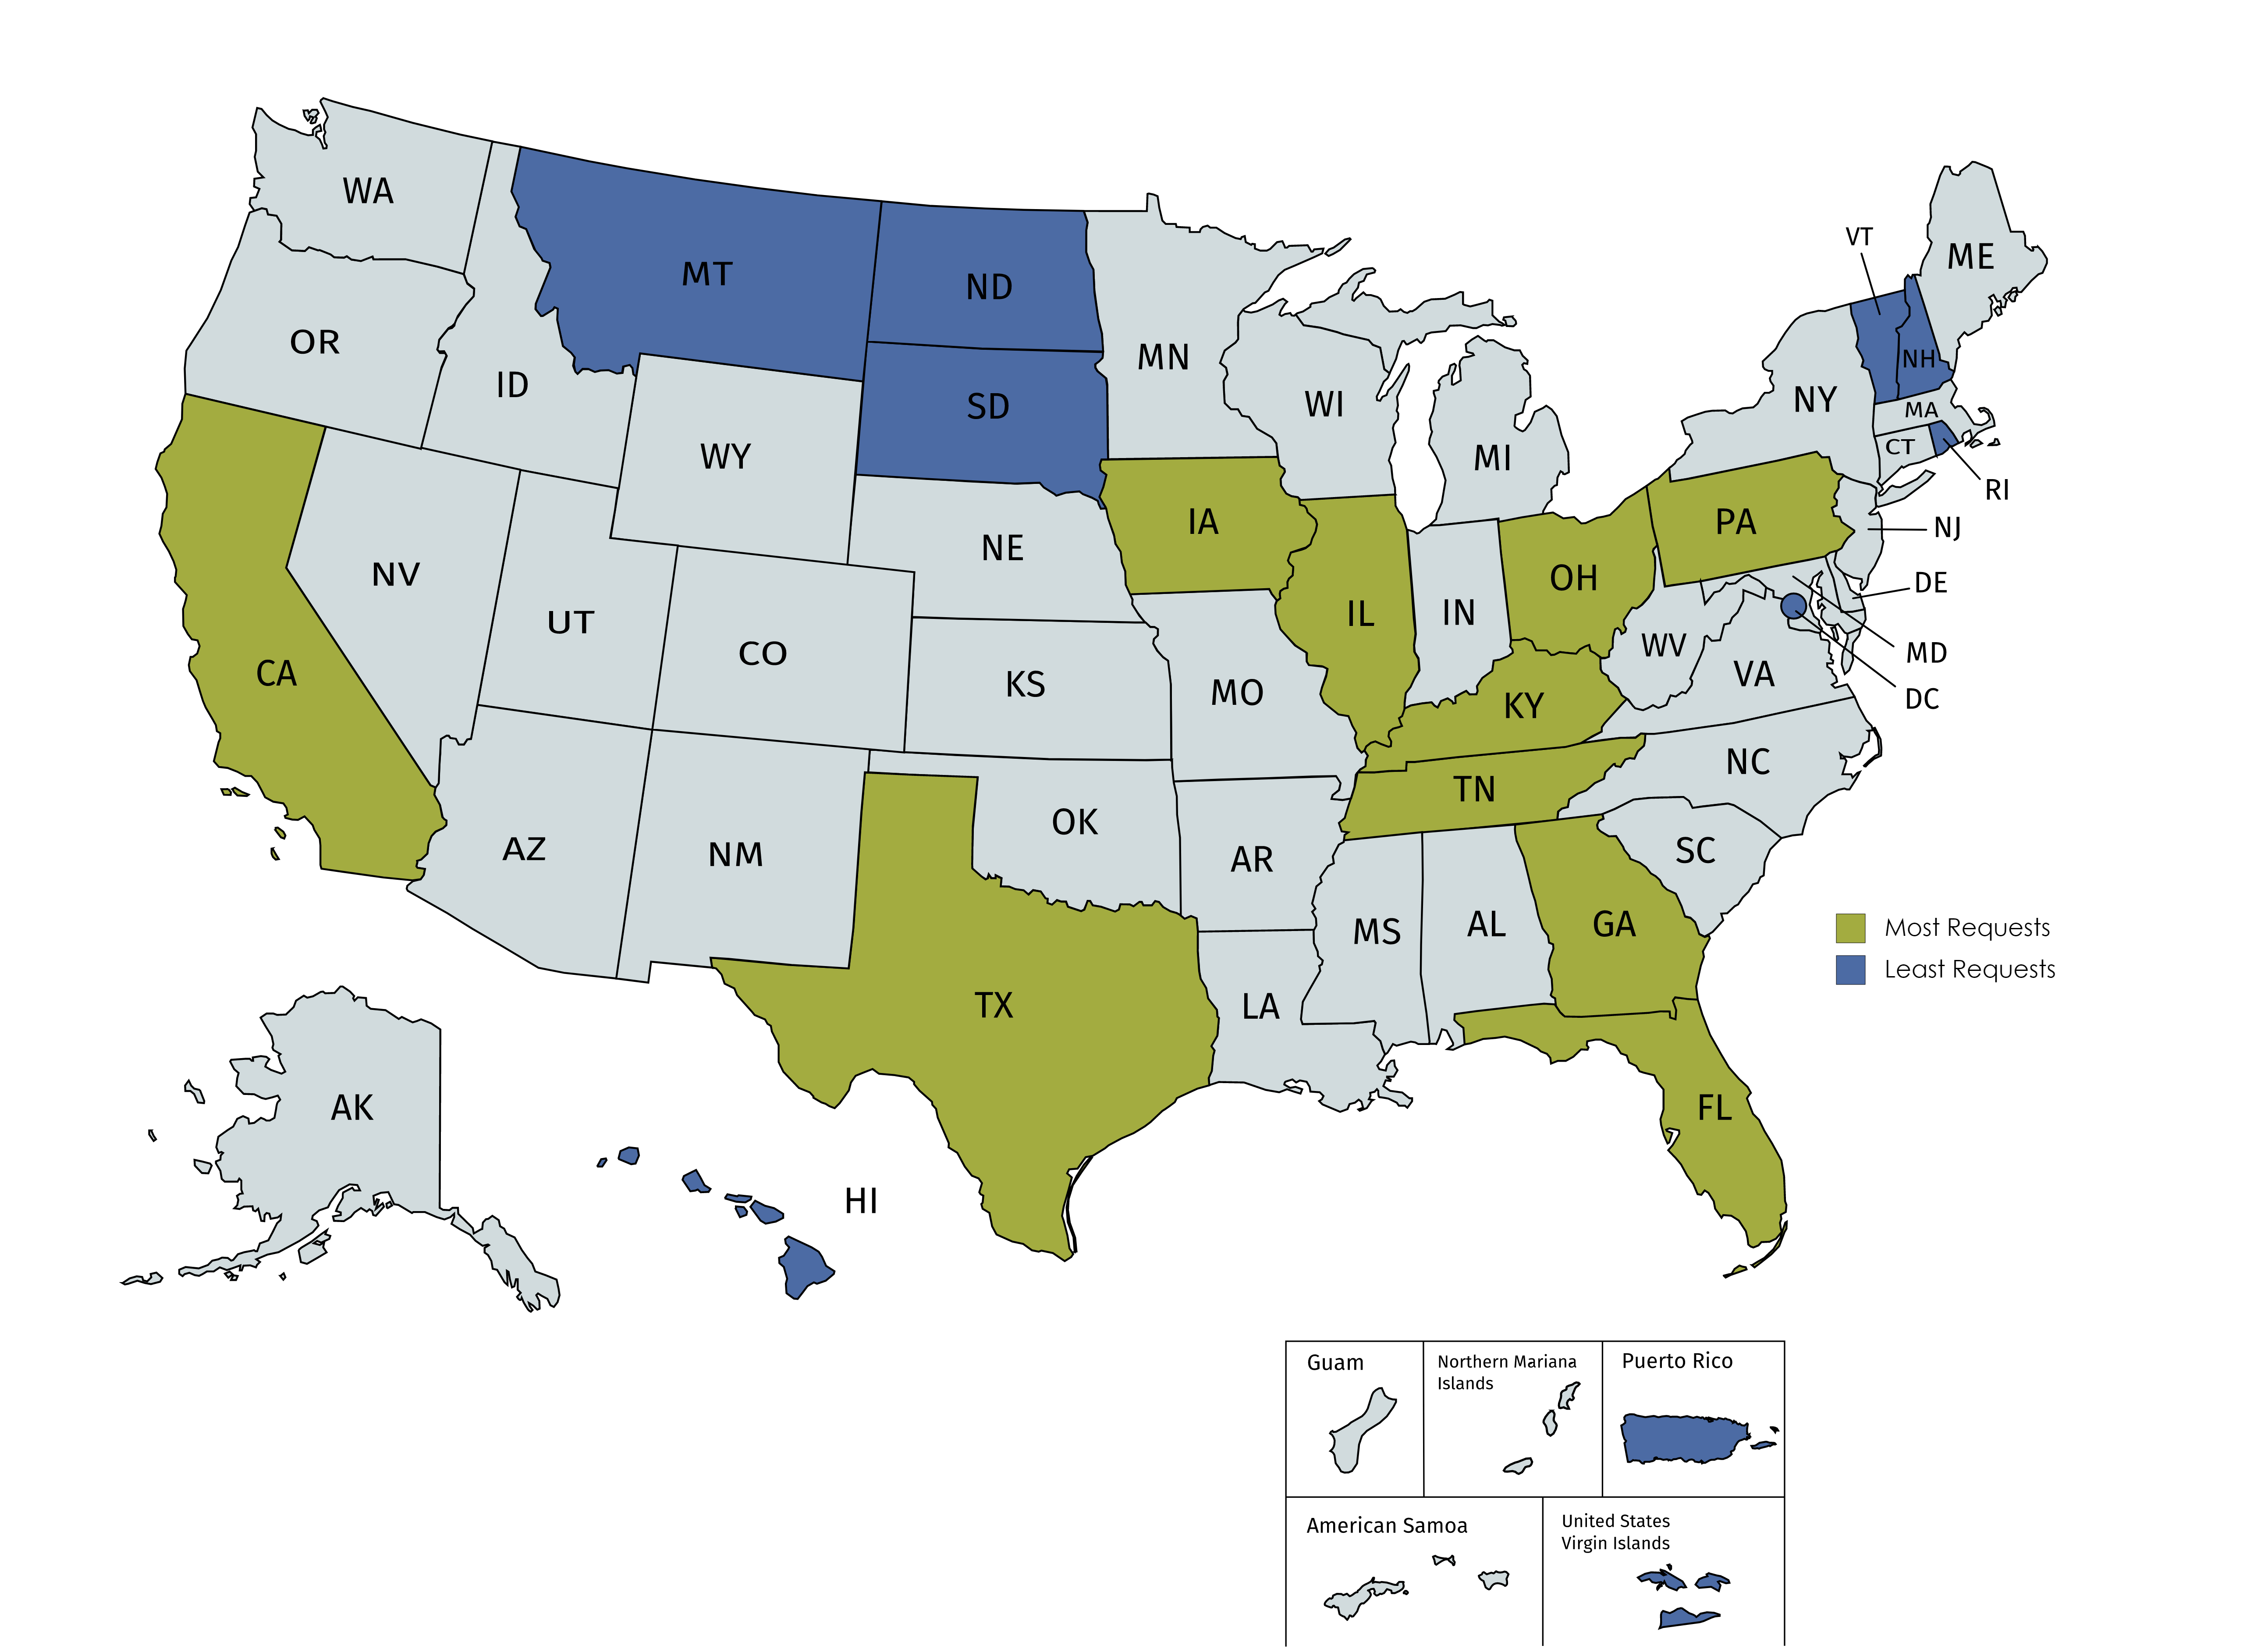
States issuing most and least requests for WOTC Certification in 2018.
Most Requests
- California 617,198
- Texas 573,089
- Ohio 522,874
- Illinois 332,838
- Pennsylvania 325,786
- Tennessee 322,759
- Florida 295,442
- Iowa 295,058
- Georgia 288,119
- Kentucky 265,889
Least Requests
- Virgin Islands 383
- Rhode Island 7,750
- DC 8,472
- South Dakota 9,173
- Puerto Rico 10,961
- North Dakota 12,138
- Vermont 15,148
- Montana 16,554
- Hawaii 18,145
- New Hampshire 20,841
What are the most popular WOTC Target Groups / Categories?
| WOTC Target Groups | Total Credits | Percentage |
| Summer Youth | 630 | 0.03% |
| Disabled Veteran | 4,791 | 0.22% |
| Ticket Holder | 4,832 | 0.22% |
| Disabled Veteran unemp. 6 Mo. | 12,917 | 0.59% |
| Veteran Receiving SNAP | 23,349 | 1.06% |
| Vocational Rehabilitation | 48,300 | 2.19% |
| SSI Recipient | 54,856 | 2.49% |
| Long Term Unemployment | 62,459 | 2.84% |
| Veteran unemp. 4 Wk | 70,450 | 3.20% |
| IV-A (TANF) | 77,818 | 3.53% |
| Ex-Felon | 85,796 | 3.90% |
| Veteran unemp. 6 Mo. | 86,638 | 3.93% |
| Designated Community Resident | 87,230 | 3.96% |
| Long term IV-A (TANF) | 123,535 | 5.61% |
| SNAP (FS) | 1,458,420 | 66.23% |
You can see from the table above that SNAP (FS) dominated all categories with 1,458,420 qualified certifications in 2018, or a total of 66.23% of all qualified employees. This was the most popular category, by a wide margin.
The Qualifying Veteran categories total 9.00% of the total qualifying categories, coming in second. The most popular Veteran category was the Veteran unemployed 6 Months 3.93%. Veteran unemployed 4 Weeks 3.20%, Veteran Receiving SNAP 1.06%, Disabled Veteran unemployed 6 Months 0.59% and Disabled Veteran 0.22%.
The third most popular category was the Long term IV-A (TANF) which had 123,535 total certifications issued, and only 5.61% of the total. This is a tax credit that is taken over two years.
States with most WOTC Tax Credits for SNAP Recipients (food stamps):
- Texas 143,820
- Illinois 93,430
- Florida 89,236
- California 83,996
- Ohio 72,656
- Georgia 59,778
- Pennsylvania 57,646
- Tennessee 55,269
- North Carolina 54,273
- Michigan 54,119
States with most WOTC Tax Credits for qualified Veterans (over all five vet. categories):
- Texas 23,431
- Georgia 16,589
- California 14,104
- Pennsylvania 13,386
- Florida 10,915
- Ohio 9,230
- Arizona 6,807
- Missouri 6,783
- Kentucky 6,083
- North Carolina 5,964
States with most WOTC Tax Credits for TANF (Temporary Assistance to Needy Families):
The IV-A (TANF) category had 77,818 qualified certifications at 3.53% overall.
- California 15,092
- Wisconsin 9,565
- Pennsylvania 5,546
- Delaware 5,309
- Tennessee 4,248
- Minnesota 3,335
- Virginia 3,300
- Ohio 2,710
- Kentucky 2,238
- Massachusetts 2,224
The Long term IV-A (TANF) – Credit Taken Over Two Years – had 123,535 qualified certifications at 5.61% overall.
- California 22,070
- Indiana 13,168
- Pennsylvania 9,262
- Virginia 7,623
- Wisconsin 6,740
- Ohio 6,666
- Iowa 5,897
- Illinois 4,812
- New York 4,209
- Missouri 4,190
States with most WOTC Tax Credits for Ex-Felons
Most felon friendly states:
Ex-Felon was the sixth most popular qualifying category, at only 3.90% and 85,796 certifications issued. So which state had the most ex-felons qualifying? (Why you shouldn’t overlook hiring Ex-Offenders.)
- Texas 9,384
- Georgia 7,126
- Wisconsin 6,151
- Missouri 5,222
- Kentucky 4,876
- Indiana 4,409
- Arkansas 3,678
- California 3,455
- Tennessee 3,187
- Iowa 3,166
States with most WOTC Tax Credits for Designated Community Residents
The Designated Community Resident category had 87,230 qualified certifications at 3.96% overall.
- Texas 11,876
- Arkansas 7,654
- Kentucky 6,642
- Ohio 6,154
- New York 5,401
- Iowa 5,211
- Michigan 4,463
- Missouri 4,373
- Mississippi 3,488
- West Virginia 3,209
States with most WOTC Tax Credits for SSI Recipients
The SSI Recipient category had 54,853 qualified certifications at 2.49% overall.
- California 8,658
- Michigan 4,099
- Indiana 3,410
- Pennsylvania 3,137
- Texas 2,841
- New Jersey 2,390
- Alabama 1,979
- Kentucky 1,837
- Missouri 1,819
- Massachusetts 1,645
States with most WOTC Tax Credits for Long Term Unemployment Recipients
The Long Term Unemployment category received 2.84% of all certifications for a total of 62,459 certifications. To be expected with unemployment at a record low currently.
- California 8,896
- New Jersey 7,357
- Texas 6,391
- New York 4,615
- Illinois 4,002
- Washington 3,448
- Kentucky 2,143
- Indiana 1,910
- Massachusetts 1,888
- Minnesota 1,792
States with most WOTC Tax Credits for Vocational Rehabilitation:
The Vocational Rehabilitation category had 48,300 qualified certifications at 2.19% overall.
- Michigan 15,917
- Texas 9,213
- North Carolina 2,432
- Missouri 2,056
- Florida 1,897
- Pennsylvania 1,366
- South Carolina 1,257
- California 1,129
- Washington 1,010
- Oregon 877
State with most WOTC Tax Credits for Ticket-to-Work Holders:
The Ticket Holder category had 4,832 qualified certifications at 0.22% overall.
- Ohio 791
- Massachusetts 550
- Alabama 334
- Iowa 315
- New York 295
- Missouri 273
- South Carolina 273
- Georgia 261
- Indiana 238
- Arizona 222
States with most WOTC Tax Credits for Summer Youth:
The Summer Youth category was the smallest WOTC category with just 630 qualified certifications at 0.03% of the total overall.
- Texas 190
- Missouri 55
- North Dakota 44
- Arkansas 38
- Mississippi 36
- Ohio 35
- Tennessee 35
- New York 33
- Wyoming 29
- Maine 23
View WOTC Statistics from 2015-2018 by State:
About Our WOTC Screening Services
- Why you should use CMS’s WOTC Tax Screening Service rather than doing it yourself.
- Get an idea of how much you could be saving by utilizing the Work Opportunity Tax Credit for your company, try our WOTC Calculator.
- Are you a CPA or tax service provider? Find out how you can become a strategic Business Partner.
Contact Us for More Information or To Get Started Today
In our 21+ years of performing WOTC Screening and Administration we’ve saved millions for our customers.
Contact CMS today to start taking advantage. Call 800-517-9099, or click here to use our contact form to ask any questions.
Error: Contact form not found.