
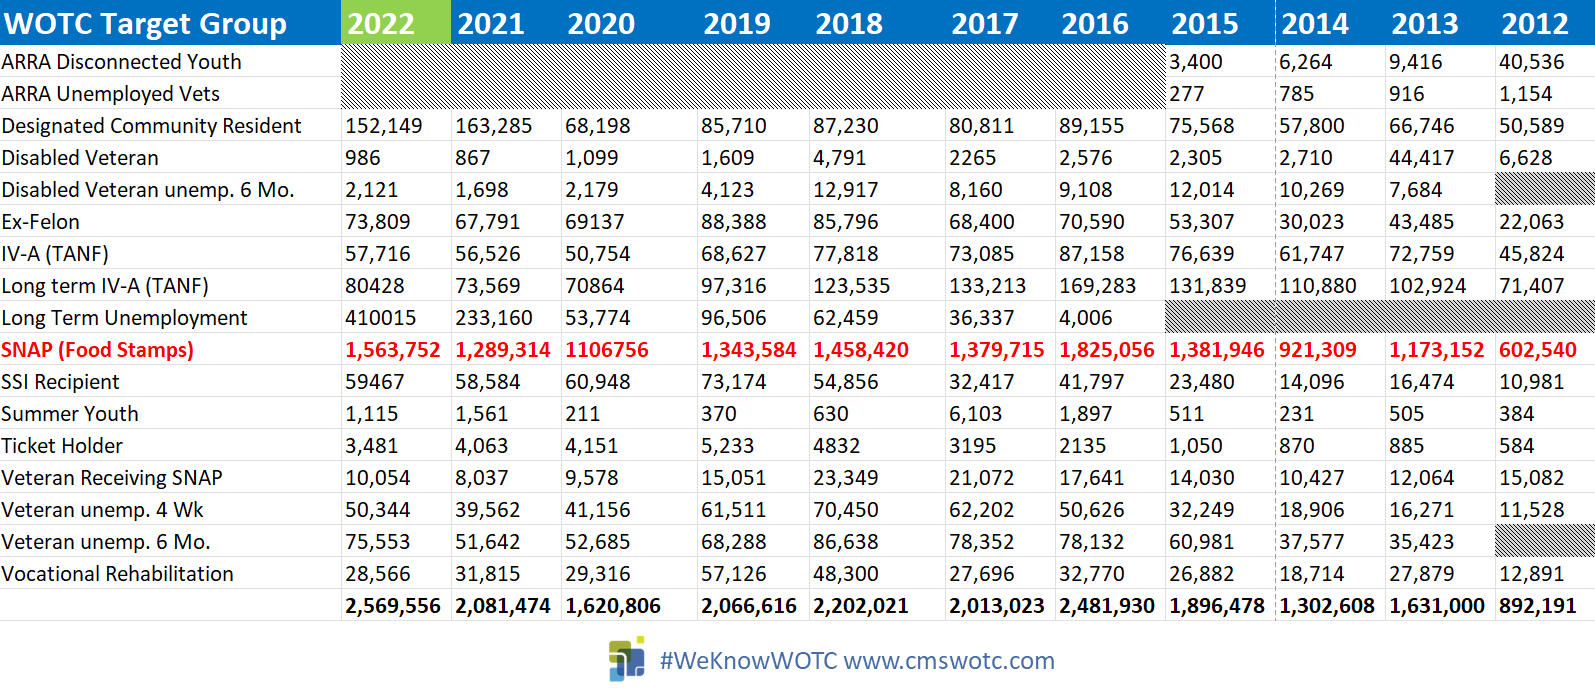
MARCH 2023 – The latest statistics for the Work Opportunity Tax Credit from 2022 have recently been released by the U.S. Department of Labor, and the data shows that a total of 2,569,646 total Work Opportunity Tax Credits were issued in the United States in 2022.
This represents an almost 23.45% increase over the previous year 2021 (2,081,474 credits), 2020 (1,620,806 credits), 2019 (2,066,616 credits), and 2018 (2,204,142 credits), and shows the continued impact of COVID-19 on the U.S. economy.
The Long-Term Unemployment target group saw a 75.85% increase year over year with 410,015 certifications in 2022 versus 233,160 in 2021. While SNAP, which continues to be the Work Opportunity Tax Credit’s largest category saw a 21.29% increase with 1,563,752 certifications in 2022 versus 1,289,314 in 2021
Although the actual value of the issued tax credits would actually vary based on hours worked, and category the employee came in under, we are using the average tax credit value of $2,400. This would give us a potential total value of 2022’s tax credits at up to an impressive $6.1 Billion.
View WOTC Statistics from 2014-2022 by State/Territory:
Work Opportunity Tax Credit Statistics By Target Group 2022
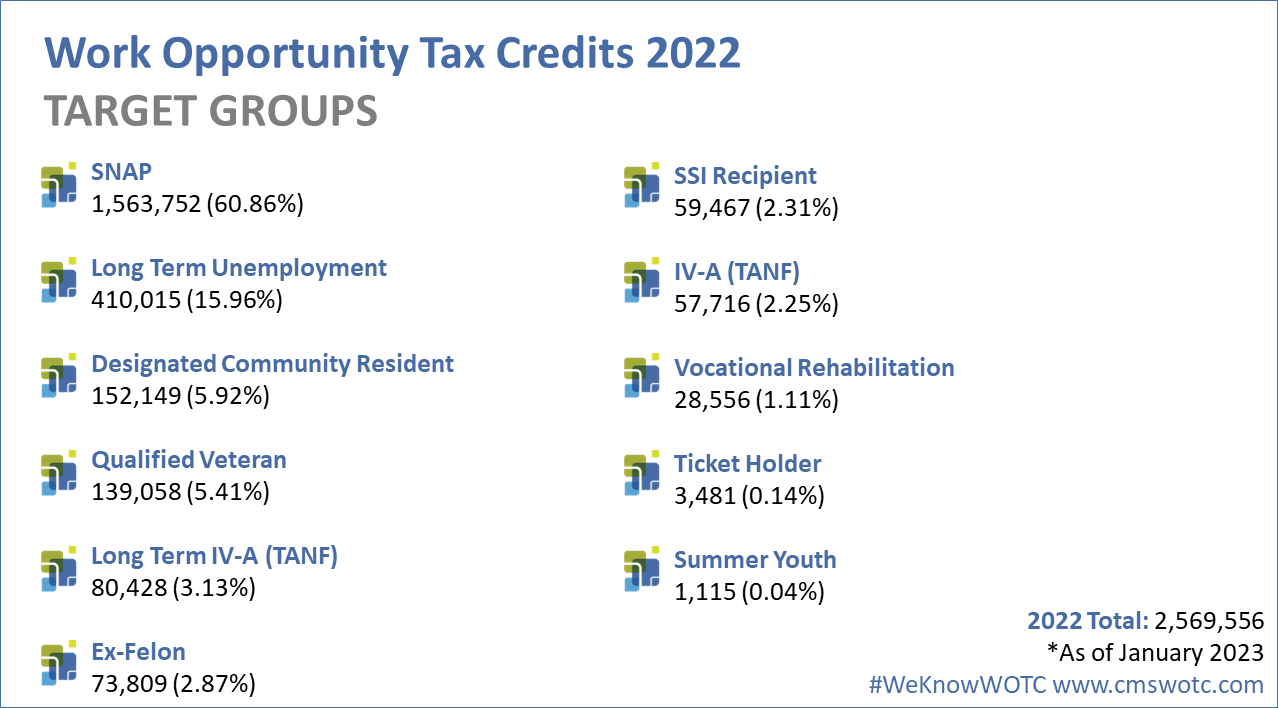
SNAP (food Stamps) continues to be the highest WOTC qualifying target group with 60.86%, the next highest category was Long Term Unemployment saw a 4.76% increase over the previous year, climbing for the second consecutive year.
Since it was introduced in 2017, the Long Term Unemployment category has never reached over 4.67% of the total. Until 2021 that is. At 410,015 certifications, it’s now more than 4 times higher than 2019.
The numbers reflect the state of the labor market at that time. Unemployment was very high from April 2020 to December 2021, peaking at 14.7 million unemployed in April 2020. As of February 2022, unemployment is 5.7 million (Source BLS).
The Qualifying Veteran categories total 5.41% of the total qualifying categories, coming in fourth. The most popular Veteran category was the Veteran unemployed 6 Months (75,553 total) 2.94%. Veteran unemployed 4 Weeks (50,344 total) 1.96%, Veteran Receiving SNAP (10,054 total) 0.39%, Disabled Veteran unemployed 6 Months (2,121 total) 0.08% and Disabled Veteran (986 total) 0.04%.
Work Opportunity Tax Credit Statistics By Target Group 2012-2022
States Issuing Most Credits by Target Group 2022
Texas and California issued the most certifications in most categories in 2022. California issued the most overall certifications with 212,688.
| WOTC Target Groups 2022 | State Issuing Most Credits | Number of Credits |
| SNAP (FS) | Florida | 125,471 |
| Long Term Unemployment | California | 65,795 |
| Designated Community Resident | Texas | 19,291 |
| Long term IV-A (TANF) | California | 15,119 |
| Ex-Felon | Texas | 8,550 |
| SSI Recipient | California | 6,284 |
| IV-A (TANF) | California | 10,585 |
| Veteran unemp. 6 Mo. | California | 7,347 |
| Veteran unemp. 4 Wk | Florida | 4,457 |
| Vocational Rehabilitation | Texas | 5,748 |
| Veteran Receiving SNAP | North Carolina | 1,592 |
| Ticket Holder | Massachusetts | 516 |
| Disabled Veteran unemp. 6 Mo. | Georgia | 335 |
| Summer Youth | Texas | 318 |
Which states issued the most WOTC tax credits in 2022?
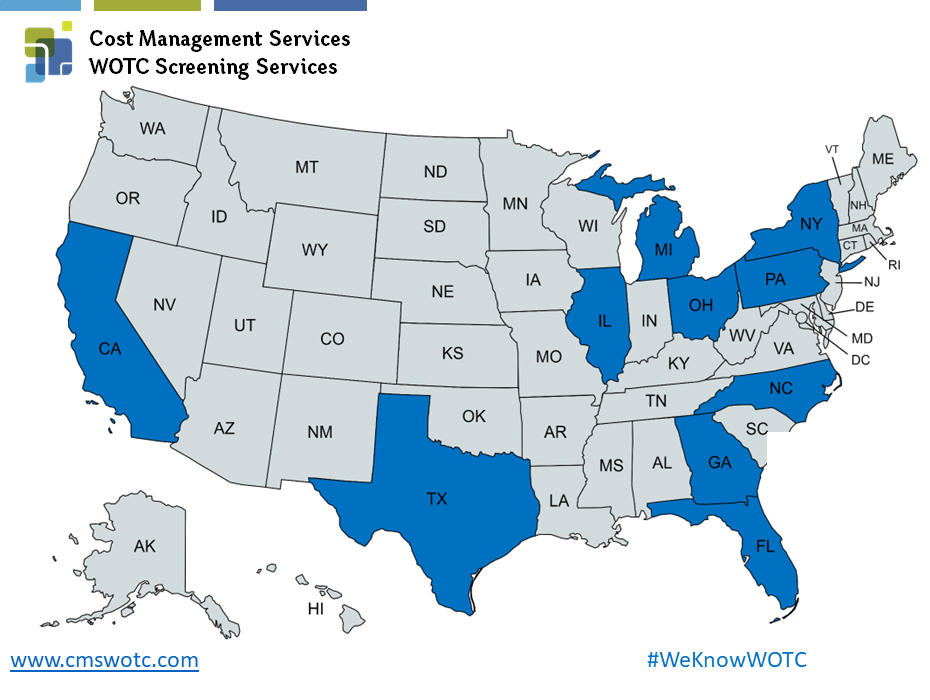
California issued 212,688 certifications in 2022 making it the largest issuer of Work Opportunity Tax Credit certifications. Texas came in second with 192,950, and Florida third with 143,768.
States that issued the most WOTC tax credits 2022
- California 212,688 (8.28% of total)
- Texas 192,950 (7.51% of total)
- Florida 183,992 (7.16% of total)
- New York 179,446 (6.98% of total)
- Ohio 143,768 (5.59% of total)
- Illinois 136729 (5.32% of total)
- Michigan 112,893 (4.39% of total)
- North Carolina 100,052 (3.89% of total)
- Pennsylvania 91,670 (3.57% of total)
- Georgia 84,026 (3.27% of total)
Which states received the most and least requests for WOTC?
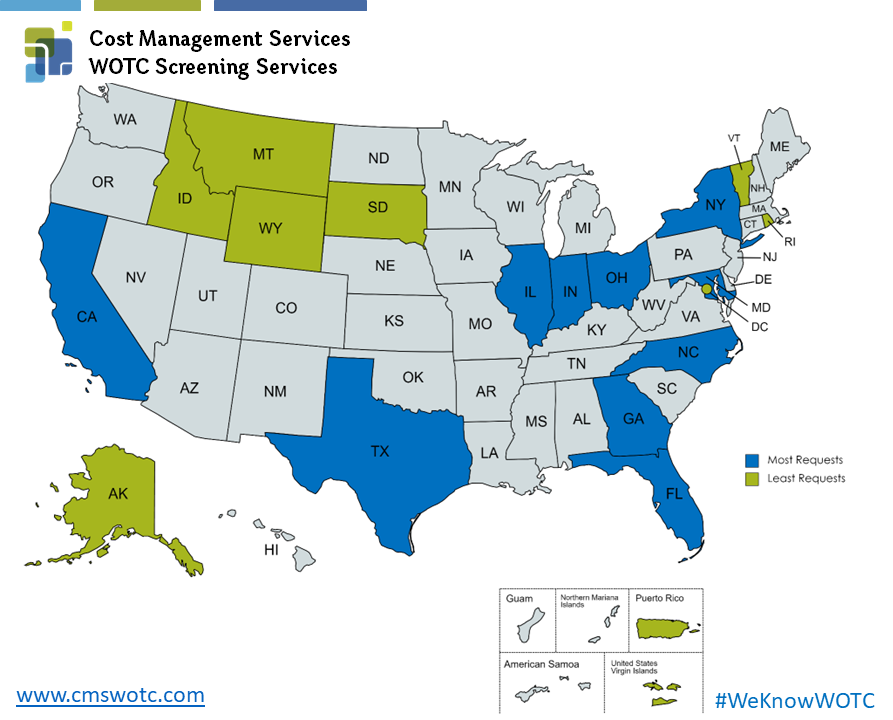
Most Requests
- California 919,156
- Texas 865,127
- Ohio 662,594
- Florida 467,125
- Maryland 437,758
- New York 428,502
- Georgia 378,674
- Illinois 352,089
- Indiana 298,880
- North Carolina 289,887
Least Requests
- Virgin Islands 966
- Wyoming 7,380
- Puerto Rico 9,670
- Montana 15,219
- Rhode Island 17,033
- Washington, DC 19,267
- Alaska 19,801
- Vermont 19,936
- South Dakota 20,216
- Idaho 26,734
Which states issued most denials?
Unsurprisingly, Texas has, so far, issued the most denials for WOTC certifications in 2022 with 564,171. Ohio coming in second with 333,668 denials. What causes Work Opportunity Tax Credits to be denied?
- Texas 564,171
- Ohio 333,668
- California 322,274
- Florida 264,949
- Illinois 203,536
- New York 201,687
- Pennsylvania 176,823
- Arizona 170,089
- Georgia 164,326
- North Carolina 157,937
Which states have the biggest WOTC backlog?
This is important to consider. At CMS, we are always asked the question “How long does it take to receive a WOTC Tax Credit?” Well, it always depends on how much of a backlog the state you are in is currently working on. In 2020 12 states were issued grants to help alleviate their WOTC backlogs and update their systems. This is still an ongoing process for most states.
California currently has the most pending requests at 384,194, Maryland at 306,372. Ohio, Indiana, Georgia, New Jersey and Texas have over 100,000 requests pending for 2022. (As of February 2023 reporting.)
- California 384,194
- Maryland 306,372
- Ohio 185,158
- Indiana 178,728
- Georgia 130,322
- New Jersey 121,424
- Texas 108,006
- Connecticut 80,767
- Nevada 79,855
- Missouri 79,650
Congratulations to Pennsylvania, New Mexico, Montana and Wyoming who do not have any pending requests!
States with most WOTC Tax Credits for SNAP Recipients (food stamps):
The SNAP target group is consistently where the most certifications fall into. In 2022 1,563,752 certifications were issued, or 60.86% of the total.
- Florida 125,471
- Texas 115,156
- Illinois 98,393
- California 88,328
- New York 85,662
- Ohio 78,400
- Michigan 70,876
- Pennsylvania 70,431
- North Carolina 66,336
- Georgia 62,544
States with most WOTC Tax Credits for Long Term Unemployment Recipients
The Long Term Unemployment target group received 15.96% of all certifications for a total of 410,015 certifications in 2022. This was a huge 75.85% increase over the previous year which had 233,160 certifications for this category.
- California 65,795
- New York 53,707
- Florida 34,337
- Texas 29,496
- Ohio 24,190
- Illinois 22,979
- Michigan 22,932
- Georgia 10,873
- North Carolina 10,468
- Arizona 10,118
States with most WOTC Tax Credits for Designated Community Residents
The Designated Community Resident category had 152,149 qualified certifications at 5.92% overall in 2022.
Hawaii, Rhode Island, Idaho, Washington, DC, Puerto Rico and the US Virgin Islands had no qualifying tax credits for this category.
- Texas 19,291
- Ohio 16,566
- New York 16,125
- California 11,167
- Iowa 7,717
- Alabama 6,344
- Virginia 6,039
- North Dakota 5,905
- Michigan 5,292
- Illinois 5,115
States with most WOTC Tax Credits for Qualified Veterans
The Qualified Veteran category had 139,058 qualified certifications at 5.41% overall. (over all five vet. categories – Veteran Receiving SNAP, Disabled Veteran, Disabled Veteran unemp. 6 Mo., Veteran unemp. 4 Wk, Veteran unemp. 6 Mo.).
- North Carolina 11,982
- California 10,960
- Florida 10,035
- Texas 7,035
- Ohio 6,965
- New York 6,949
- Arizona 6,450
- Virginia 6,436
- Colorado 5,526
- Georgia 4,630
Qualified Veteran Breakdown:
| WOTC Target Group | Total Credits | Percentage | State with Most in Category |
| Veteran Receiving SNAP | 10,054 | 0.39% | North Carolina (1,592) |
| Disabled Veteran | 986 | 0.04% | Colorado (320) |
| Disabled Veteran unemp. 6 Mo. | 2,121 | 0.08% | Georgia (335) |
| Veteran unemp. 4 Wk | 50,344 | 1.96% | Florida (4,457) |
| Veteran unemp. 6 Mo. | 75,553 | 2.94% | California (7,347) |
States with most WOTC Tax Credits for TANF (Temporary Assistance to Needy Families):
The Long term IV-A (TANF) – Credit Taken Over Two Years – had 80,428 qualified certifications at 3.13% overall.
- California 15,119
- New York 8,481
- Ohio 6,736
- Minnesota 4,753
- Massachusetts 4,077
- Florida 3,826
- Illinois 3,464
- Pennsylvania 3,435
- Kentucky 3,173
- Virginia 3,130
The IV-A (TANF) category had 57,716 qualified certifications at 2.25% overall.
- California 10,585
- Wisconsin 8,703
- Pennsylvania 3,538
- Tennessee 3,479
- Minnesota 3,458
- Massachusetts 2,229
- Washington 2,222
- New York 1,983
- Ohio 1,913
- Oregon 1,756
Most felon friendly states: States with most WOTC Tax Credits for Ex-Felons
Ex-Felon was the sixth most popular qualifying category, at only 2.87% and 73,809 certifications issued. So which state had the most ex-felons qualifying? (Why you shouldn’t overlook hiring Ex-Offenders.)
- Texas 8,550
- North Carolina 7,681
- Georgia 3,536
- Ohio 3,502
- Kentucky 2,926
- Wisconsin 2,704
- Iowa 2,694
- Illinois 2,646
- Arkansas 2,443
- Tennessee 2,377
States with most WOTC Tax Credits for SSI Recipients
The SSI Recipient category had 59,467 qualified certifications at 2.31% overall in 2022.
- California 6,284
- Texas 5,743
- Michigan 5,314
- Pennsylvania 3,652
- Maryland 3,434
- Ohio 3,251
- New York 3,079
- Florida 2,339
- Wisconsin 2,288
- Arizona 1,755
States with most WOTC Tax Credits for Vocational Rehabilitation:
The Vocational Rehabilitation category had 28,566 qualified certifications at 1.11% overall in 2022.
- Texas 5,748
- California 2,288
- Ohio 2,061
- Florida 1,947
- North Carolina 1,609
- Kentucky 1,493
- Michigan 1,392
- New York 1,181
- Pennsylvania 932
- Alabama 886
State with most WOTC Tax Credits for Ticket-to-Work Holders:
The Ticket Holder category had 3,481 qualified certifications at 0.14% overall in 2022.
- Massachusetts 516
- New York 503
- South Carolina 364
- Alabama 290
- Iowa 171
- Georgia 165
- Colorado 147
- Oregon 107
- North Carolina 103
- Arizona 101
States with most WOTC Tax Credits for Summer Youth:
The Summer Youth category was the smallest WOTC category with just 1,115 qualified certifications at 0.04% of the total overall in 2022.
- Texas 318
- Ohio 179
- California 153
- Virginia 70
- New York 67
- Tennessee 67
- Oklahoma 49
- Florida 40
- Missouri 31
- Mississippi 28
About Our WOTC Screening Services
- Why you should use CMS’s WOTC Tax Screening Service rather than doing it yourself.
- Get an idea of how much you could be saving by utilizing the Work Opportunity Tax Credit for your company, try our WOTC Calculator.
- Are you a CPA or tax service provider? Find out how you can become a strategic Business Partner.
Contact Us for More Information or To Get Started Today
In over 25 years of performing WOTC Screening and Administration we’ve saved millions for our customers.
Contact CMS today to start taking advantage. Call 800-517-9099, or contact us below with any questions.