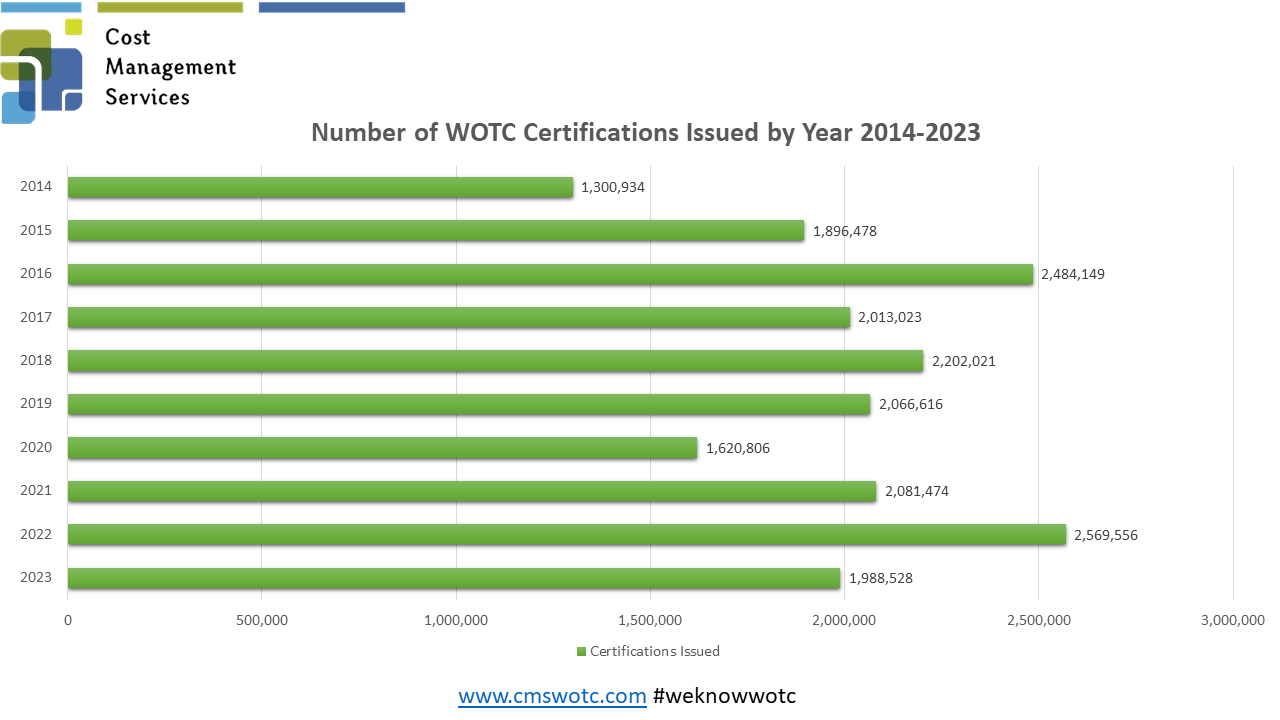
MARCH 2024 – The latest statistics for the Work Opportunity Tax Credit from 2023 have recently been released by the U.S. Department of Labor, and the data shows that a total of 1,988,528 total Work Opportunity Tax Credits were issued in the United States in 2023.
This represents an almost 23% decrease over the previous year 2022 (2,569,556 credits), 2021 (2,081,474 credits), 2020 (1,620,806 credits), 2019 (2,066,616 credits), and 2018 (2,204,142 credits).
SNAP, which continues to be the Work Opportunity Tax Credit’s largest category saw a 17% decrease with 1,289,001 certifications in 2023 versus 1,563,752 in 2022. Designated Community Resident moved into second place in 2023 over Long Term Unemployed with 158,715 certifications for that target group.
Although the actual value of the issued tax credits would actually vary based on hours worked, and category the employee came in under, we are using the average tax credit value of $2,400. This would give us a potential total value of 2023’s tax credits at up to an impressive $4.7 Billion.
View WOTC Statistics from 2014-2023 by State/Territory:
Work Opportunity Tax Credit Statistics By Target Group 2023
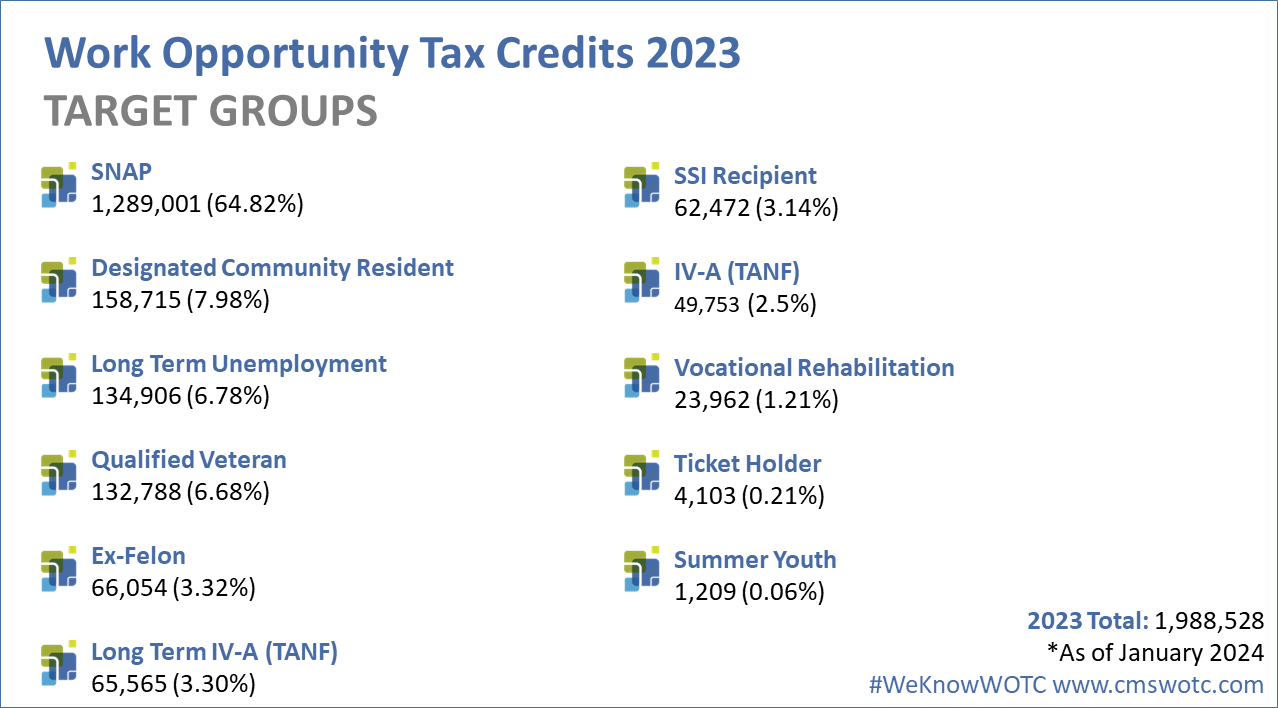
SNAP (food Stamps) continues to be the highest WOTC qualifying target group with 64.82%, the next highest category was Designated Community Resident which had an 4.32% increase over the previous year and replacing Long Term Unemployment in that spot.
The Qualifying Veteran categories total 6.68% of the total qualifying categories, coming in fourth. The most popular Veteran category was the Veteran unemployed 6 Months (71,891 total) 3.62%. Veteran unemployed 4 Weeks (49,176 total) 2.47%, Veteran Receiving SNAP (8,697 total) 0.44%, Disabled Veteran unemployed 6 Months (2,059 total) 0.10% and Disabled Veteran (965 total) 0.05%.
Work Opportunity Tax Credit Statistics By Target Group 2014-2023
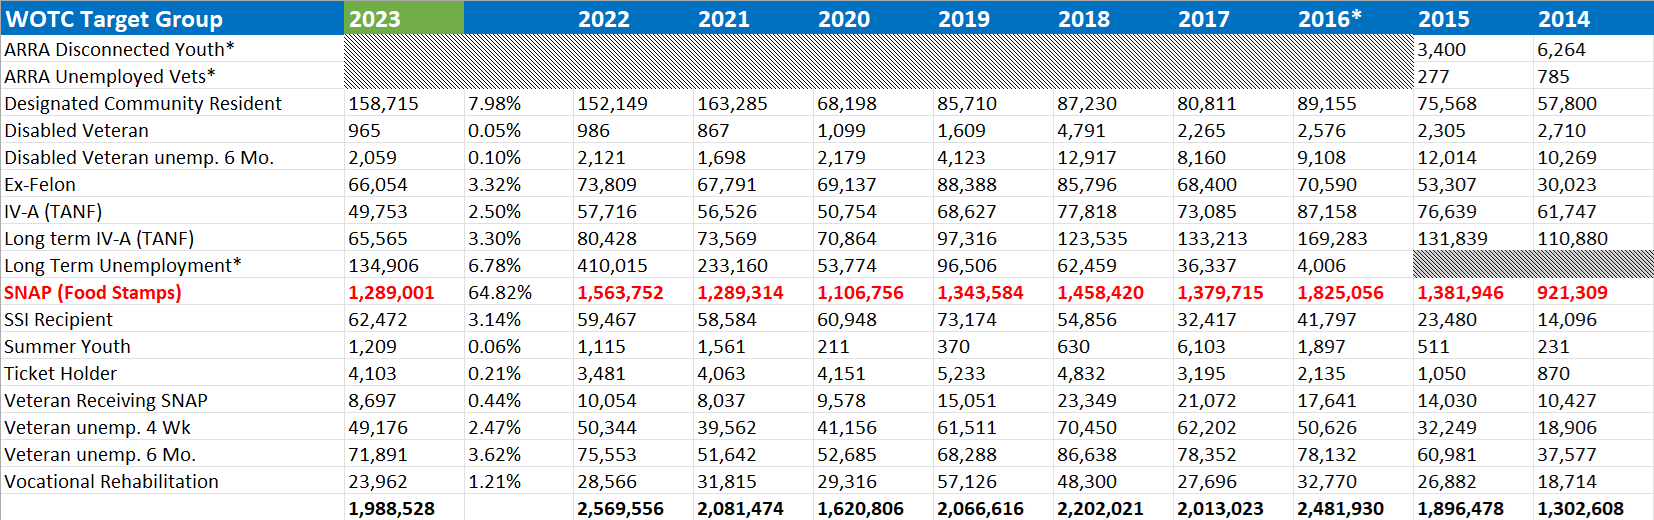
*WOTC was inactive in 2016.
*WOTC was retroactively reenacted in 1/1/2017 with a one-year look back period for 2016.
*WOTC new category of Long Term Unemployed added in 2016.
*ARRA categories retired in 2016.
States Issuing Most Credits by Target Group 2023
Texas and California issued the most certifications in most categories in 2023. California issued the most overall certifications with 184,741.
| WOTC Target Groups 2023 | State Issuing Most Credits | Number of Credits |
| SNAP (FS) | Texas | 102,891 |
| Long Term Unemployment | California | 47,354 |
| Designated Community Resident | California | 14,983 |
| Long term IV-A (TANF) | California | 12,674 |
| Ex-Felon | Texas | 6,028 |
| SSI Recipient | Texas | 4,842 |
| IV-A (TANF) | California | 11,347 |
| Veteran unemp. 6 Mo. | California | 7,032 |
| Veteran unemp. 4 Wk. | California | 3,202 |
| Vocational Rehabilitation | Texas | 3,607 |
| Veteran Receiving SNAP | Wisconsin | 611 |
| Ticket Holder | South Carolina | 558 |
| Disabled Veteran unemp. 6 Mo. | Virginia | 332 |
| Summer Youth | Texas | 263 |
| Disabled Veteran | Colorado | 261 |
Which states have the biggest WOTC backlog?
This is important to consider. At CMS, we are always asked the question “How long does it take to receive a WOTC Tax Credit?” Well, it always depends on how much of a backlog the state you are in is currently working on. In 2020 12 states were issued grants to help alleviate their WOTC backlogs and update their systems. Years later. this is still an ongoing process for most states.
Maryland currently has the highest current WOTC backlog with 341,506 requests , Indiana at 216,941. Georgia, California, and Tennessee have over 100,000 requests pending for 2023. (As of February 2024 reporting.)
- Maryland 341,506
- Indiana 216,941
- Georgia 163,591
- California 162,895
- Tennessee 134,465
- Texas 91,195
- Ohio 90,952
- New Jersey 83,316
- Missouri 72,612
- Maine 68,074
Congratulations to Pennsylvania, New Mexico, and Montana who do not have any pending requests!
About Our WOTC Screening Services
- Why you should use CMS’s WOTC Tax Screening Service rather than doing it yourself.
- Get an idea of how much you could be saving by utilizing the Work Opportunity Tax Credit for your company, try our WOTC Calculator.
- Are you a CPA or tax service provider? Find out how you can become a strategic Business Partner.
Contact Us for More Information or To Get Started Today
In over 25 years of performing WOTC Screening and Administration we’ve saved millions for our customers.
Contact CMS today to start taking advantage. Call 800-517-9099, or contact us below with any questions.