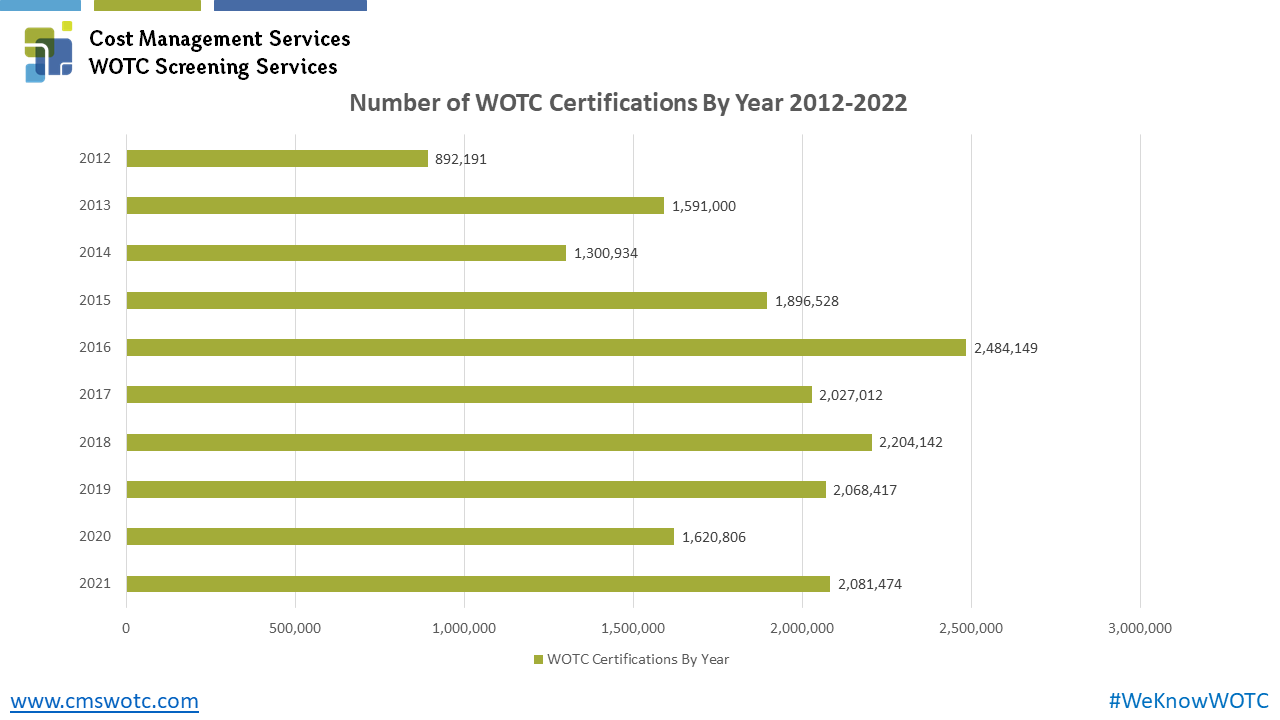
MARCH 2021 – The latest statistics for the Work Opportunity Tax Credit from 2021 have recently been released by the U.S. Department of Labor, and the data shows that a total of 2,081,474 total Work Opportunity Tax Credits were issued in the United States in 2021. This represents an almost 28% increase over previous years 2020 (1,620,806 credits), 2019 (2,066,616 credits), and 2018 (2,204,142 credits), and shows the continued impact of COVID-19 on the U.S. economy.
Although the actual value of the issued tax credits would actually vary based on hours worked, and category the employee came in under, we are using the average tax credit value of $2,400. This would give us a potential total value of 2021’s tax credits at an impressive $4,995,537,600.
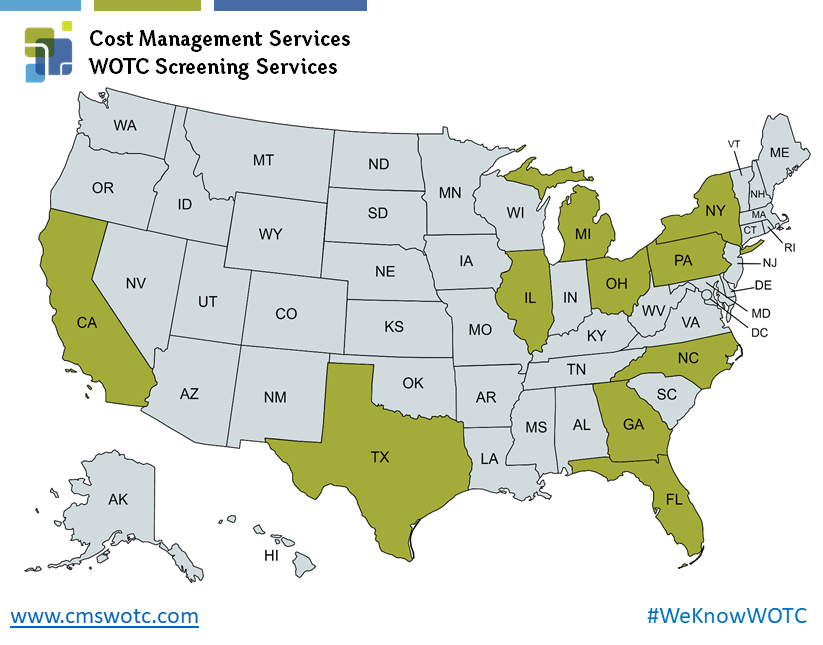
View WOTC Statistics from 2014-2021 by State:
Work Opportunity Tax Credit Statistics By Target Group 2021
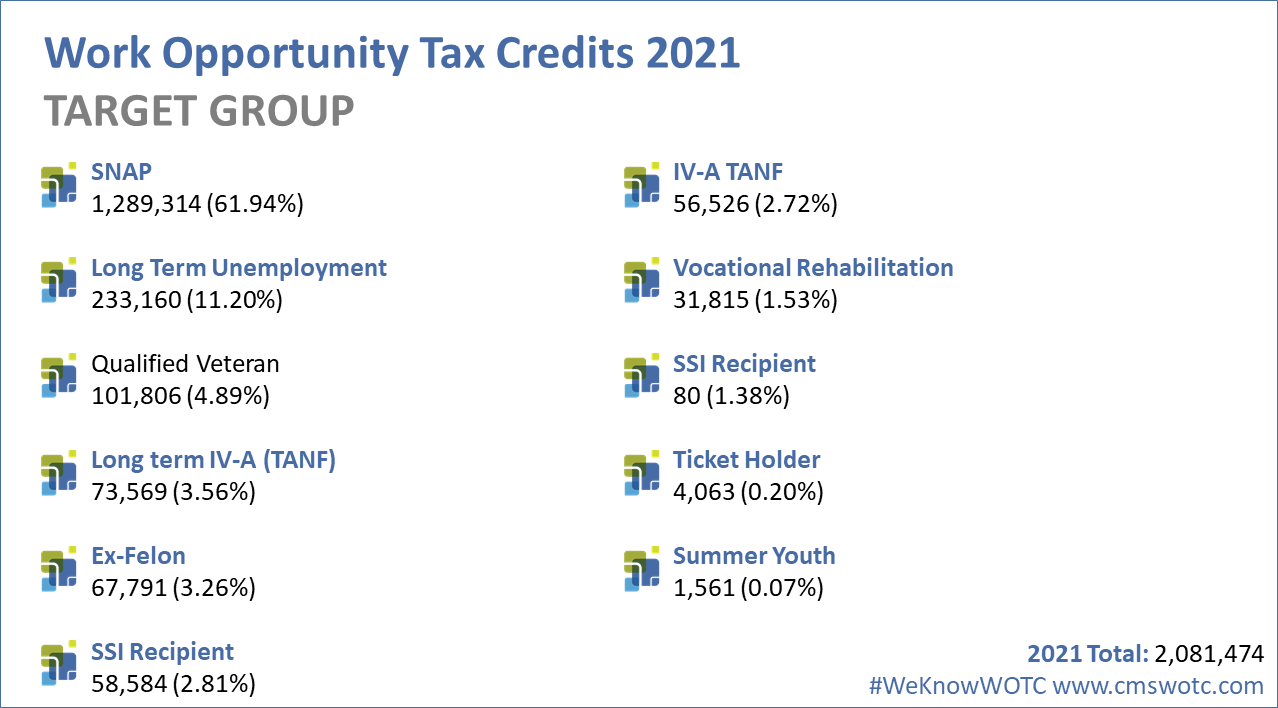
SNAP (food Stamps) continues to be the highest WOTC qualifying target group with 61.94%, the next highest category was Long Term Unemployment saw a 7.88% increase over the previous year.
Since it was introduced in 2017, the Long Term Unemployment category has never reached over 4.67% of the total. Until 2021 that is. At 233,160 certifications, more than 4 times higher than 2019, the Long Term Unemployment target group became the second highest WOTC category in 2021.
The numbers reflect the state of the labor market at that time. Unemployment was very high from April 2020 to December 2021, peaking at 14.7 million unemployed in April 2020. (Source BLS).
The Qualifying Veteran categories total 4.89% of the total qualifying categories, coming in third. The most popular Veteran category was the Veteran unemployed 6 Months 2.48%. Veteran unemployed 4 Weeks 1.90%, Veteran Receiving SNAP 0.39%, Disabled Veteran unemployed 6 Months 0.08% and Disabled Veteran 0.04%.
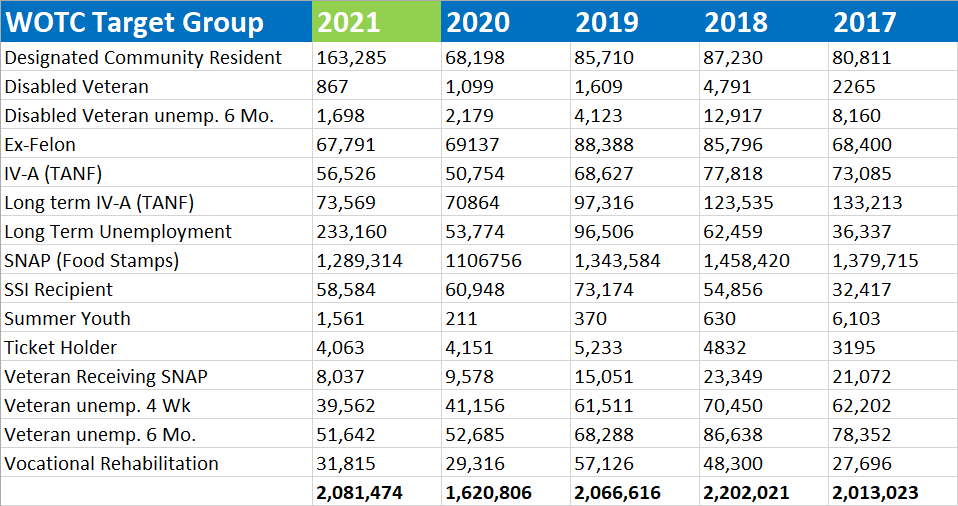
Work Opportunity Tax Credit Statistics By Target Group 2017-2021
States Issuing Most Credits by Target Group 2021
Texas and California issued the most certifications in most categories. Texas issued the most overall certifications.
| WOTC Target Groups 2021 | State Issuing Most Credits | Number of Credits |
| SNAP (FS) | Texas | 106,947 |
| Long Term Unemployment | Texas | 55,699 |
| Designated Community Resident | Texas | 19,878 |
| Long term IV-A (TANF) | California | 13,106 |
| Ex-Felon | Texas | 8,636 |
| SSI Recipient | California | 5,356 |
| IV-A (TANF) | California | 9,333 |
| Veteran unemp. 6 Mo. | California | 5,420 |
| Veteran unemp. 4 Wk | California | 3,346 |
| Vocational Rehabilitation | Texas | 5,427 |
| Veteran Receiving SNAP | Virginia | 503 |
| Ticket Holder | New York | 443 |
| Disabled Veteran unemp. 6 Mo. | Texas | 191 |
| Summer Youth | Texas | 488 |
| Disabled Veteran | Colorado | 134 |
Which states issued the most WOTC tax credits in 2021?
Texas issued 209,363 certifications in 2021 making it the largest issuer of Work Opportunity Tax Credit certifications. California came in second with 149,604, and Ohio third with 106,708, New York also issued over 100,000 certifications.
States that issued the most WOTC tax credits 2021
- Texas 209,363 (10.06% of total)
- California 149,604 (7.19% of total)
- Ohio 106,708 (5.13% of total)
- New York 101,053 (4.85% of total)
- Illinois 90,109 (4.33% of total)
- Pennsylvania 81,300 (3.91% of total)
- Georgia 80,549 (3.87% of total)
- Michigan 78,143 (3.75% of total)
- Florida 76,234 (3.66% of total)
- North Carolina 71,716 (3.45% of total)
Which states received the most and least requests for WOTC?
For the first time, a state had over one million tax credit requests. Texas received 1,003,536 requests in 2021, and has issued 209,363 tax credits.
Most Requests
- Texas 1,003,536
- California 706,883
- Florida 434,807
- New York 397,331
- Ohio 369,097
- Maryland 333,023
- Georgia 309,047
- North Carolina 302,763
- Michigan 267,695
- Illinois 258,539
Least Requests
- Virgin Islands 1,036
- Puerto Rico 6,564
- Montana 12,609
- DC 13,023
- Vermont 13,186
- South Dakota 15,270
- Rhode Island 15,503
- New Hampshire 23,237
- North Dakota 23,628
- Wyoming 26,066
Which states issued most denials?
Unsurprisingly, Texas has, so far, issued the most denials for WOTC certifications in 2021 with 682,396. Florida coming in second with 316,927 denials. What causes Work Opportunity Tax Credits to be denied?
- Texas 682,396
- Florida 316,927
- Ohio 192,004
- California 177,841
- North Carolina 175,032
- New York 174,606
- Pennsylvania 168,668
- Michigan 154,768
- Illinois 150,587
- Virginia 129,661
Which states are the most caught up and most still pending with WOTC requests?
This is important to consider. At CMS, we are always asked the question “How long does it take to receive a WOTC Tax Credit?” Well, it depends on how much of a backlog the state you are in is currently working on. Last year 12 states were issued grants to help alleviate their WOTC backlogs and update their systems.
Missouri currently has the most pending requests at 657,377, and Texas at 310,373 and Kentucky, Connecticut, Iowa, California, Kansas, Maryland, and New Jersey have over 100,000 requests pending for 2020. (As of February 2021.)
- California 379,438
- Maryland 215,306
- Indiana 133,111
- Arizona 128,526
- New York 121,672
- Georgia 119,864
- Missouri 113,675
- Texas 111,777
- Kansas 109,977
- Connecticut 108,308
Congratulations to Montana, New Mexico and Pennsylvania who do not have any pending requests!
States with most WOTC Tax Credits for SNAP Recipients (food stamps):
- Texas 106,947
- Ohio 74,147
- Georgia 72,193
- California 69,701
- Illinois 68,320
- New York 57,405
- Pennsylvania 56,198
- Florida 55,181
- Tennessee 54,421
- North Carolina 54,078
States with most WOTC Tax Credits for Qualified Veterans
The Qualified Veteran category had 101,806 qualified certifications at 4.89% overall. (over all five vet. categories – Veteran Receiving SNAP, Disabled Veteran, Disabled Veteran unemp. 6 Mo., Veteran unemp. 4 Wk, Veteran unemp. 6 Mo.).
- California 9,149
- Texas 7,690
- Washington 5,332
- Virginia 5,133
- Georgia 3,959
- Colorado 3,737
- Florida 3,713
- Indiana 3,710
- Kentucky 3,599
- Pennsylvania 3,545
States with most WOTC Tax Credits for TANF (Temporary Assistance to Needy Families):
The IV-A (TANF) category had 56,526 qualified certifications at 2.72% overall.
- California 9,333
- Wisconsin 6,748
- Tennessee 4,201
- Pennsylvania 3,689
- Minnesota 2,575
- Connecticut 2,397
- New York 2,167
- Ohio 1,952
- Kentucky 1,939
- Oregon 1,931
The Long term IV-A (TANF) – Credit Taken Over Two Years – had 73,569 qualified certifications at 3.53% overall.
- California 13,106
- New York 6,229
- Ohio 6,184
- Massachusetts 3,867
- Minnesota 3,692
- Pennsylvania 3,606
- Kentucky 3,153
- Indiana 3,139
- Florida 2,886
- Wisconsin 2,327
Most felon friendly states: States with most WOTC Tax Credits for Ex-Felons
Ex-Felon was the fifth most popular qualifying category, at only 3.26% and 67,791 certifications issued. So which state had the most ex-felons qualifying? (Why you shouldn’t overlook hiring Ex-Offenders.)
- Texas 8,636
- Indiana 7,036
- Missouri 2,929
- California 2,771
- Kentucky 2,449
- Idaho 2,355
- Tennessee 2,299
- Ohio 2,194
- Illinois 2,140
- Arkansas 2,015
States with most WOTC Tax Credits for Designated Community Residents
The Designated Community Resident category had 163,285 qualified certifications at 7.84% overall. Idaho, Washington, Delaware, Hawaii, Washington DC, Puerto Rico, the U.S. Virgin Islands and Vermont had no qualifying tax credits for this category.
- Texas 19,878
- California 19,707
- New York 16,748
- Ohio 15,389
- Minnesota 10,934
- Mississippi 7,658
- Maryland 7,161
- Virginia 6,968
- Kentucky 6,497
- North Dakota 4,930
States with most WOTC Tax Credits for SSI Recipients
The SSI Recipient category had 58,584 qualified certifications at 2.81% overall.
- California 5,356
- Michigan 4,688
- Virginia 3,810
- Pennsylvania 3,752
- Maryland 3,156
- Florida 3,119
- Texas 3,073
- Indiana 2,824
- Ohio 2,785
- North Carolina 2,605
States with most WOTC Tax Credits for Long Term Unemployment Recipients
The Long Term Unemployment category received 11.20% of all certifications for a total of 233,160 certifications. Vermont did not report any Long-Term Unemployment certifications.
- Texas 55,699
- California 19,380
- Illinois 13,213
- New York 11,431
- Washington 9,147
- Pennsylvania 8,595
- Kentucky 7,693
- Michigan 7,583
- Mississippi 7,434
- Colorado 7,260
States with most WOTC Tax Credits for Vocational Rehabilitation:
The Vocational Rehabilitation category had 31,815 qualified certifications at 1.53% overall. Vermont and the U.S. Virgin Islands did not report any Vocational Rehabilitation certifications.
- Texas 5,427
- Michigan 3,146
- Ohio 2,453
- Utah 2,203
- Florida 2,082
- North Carolina 1,650
- Kentucky 1,162
- Missouri 1,031
- Pennsylvania 994
- New York 982
State with most WOTC Tax Credits for Ticket-to-Work Holders:
The Ticket Holder category had 4,063 qualified certifications at 0.20% overall. Texas, Michigan, California, Wisconsin, Tennessee, Louisiana, Washington, New Jersey, New Hampshire, Puerto Rico, Arkansas, West Virginia, New Mexico, the U. S. Virgin Islands, and Vermont did not report any Ticket-to-Work certifications.
- New York 443
- Virginia 431
- North Carolina 366
- Alabama 307
- Massachusetts 306
- South Carolina 247
- Oregon 222
- Iowa 162
- Indiana 159
- Georgia 143
States with most WOTC Tax Credits for Summer Youth:
The Summer Youth category was the smallest WOTC category with just 1,561 qualified certifications at 0.07% of the total overall.
- Texas 488
- California 250
- Minnesota 120
- Virginia 104
- New Jersey 92
- Ohio 67
- Missouri 64
- Oklahoma 57
- Tennessee 57
- New York 48
About Our WOTC Screening Services
- Why you should use CMS’s WOTC Tax Screening Service rather than doing it yourself.
- Get an idea of how much you could be saving by utilizing the Work Opportunity Tax Credit for your company, try our WOTC Calculator.
- Are you a CPA or tax service provider? Find out how you can become a strategic Business Partner.
Contact Us for More Information or To Get Started Today
In our 25 years of performing WOTC Screening and Administration we’ve saved millions for our customers.
Contact CMS today to start taking advantage. Call 800-517-9099, or click here to use our contact form to ask any questions.