Work Opportunity Tax Credit historical data and statistics, listed by Target Group. What this data shows us, is not just the increases or decreases in participation, this shows how the changes in the economy over time and how this leads to a need for newly created or expired target groups. This shows how much money the government spends on tax credits for employers who participate in this program.
More Recent Work Opportunity Tax Credit Data:
More recent data than 2014 is not available at the national level at this time. This year we have reached out to all states to request their current WOTC statistics, which are not always available, and have heard back from: Kentucky, Massachusetts, Mississippi, Tennessee, and Utah. We will continue to update our statistics pages as information becomes available.
WOTC National Certifications By Target Group Fiscal Years 2013- 2014
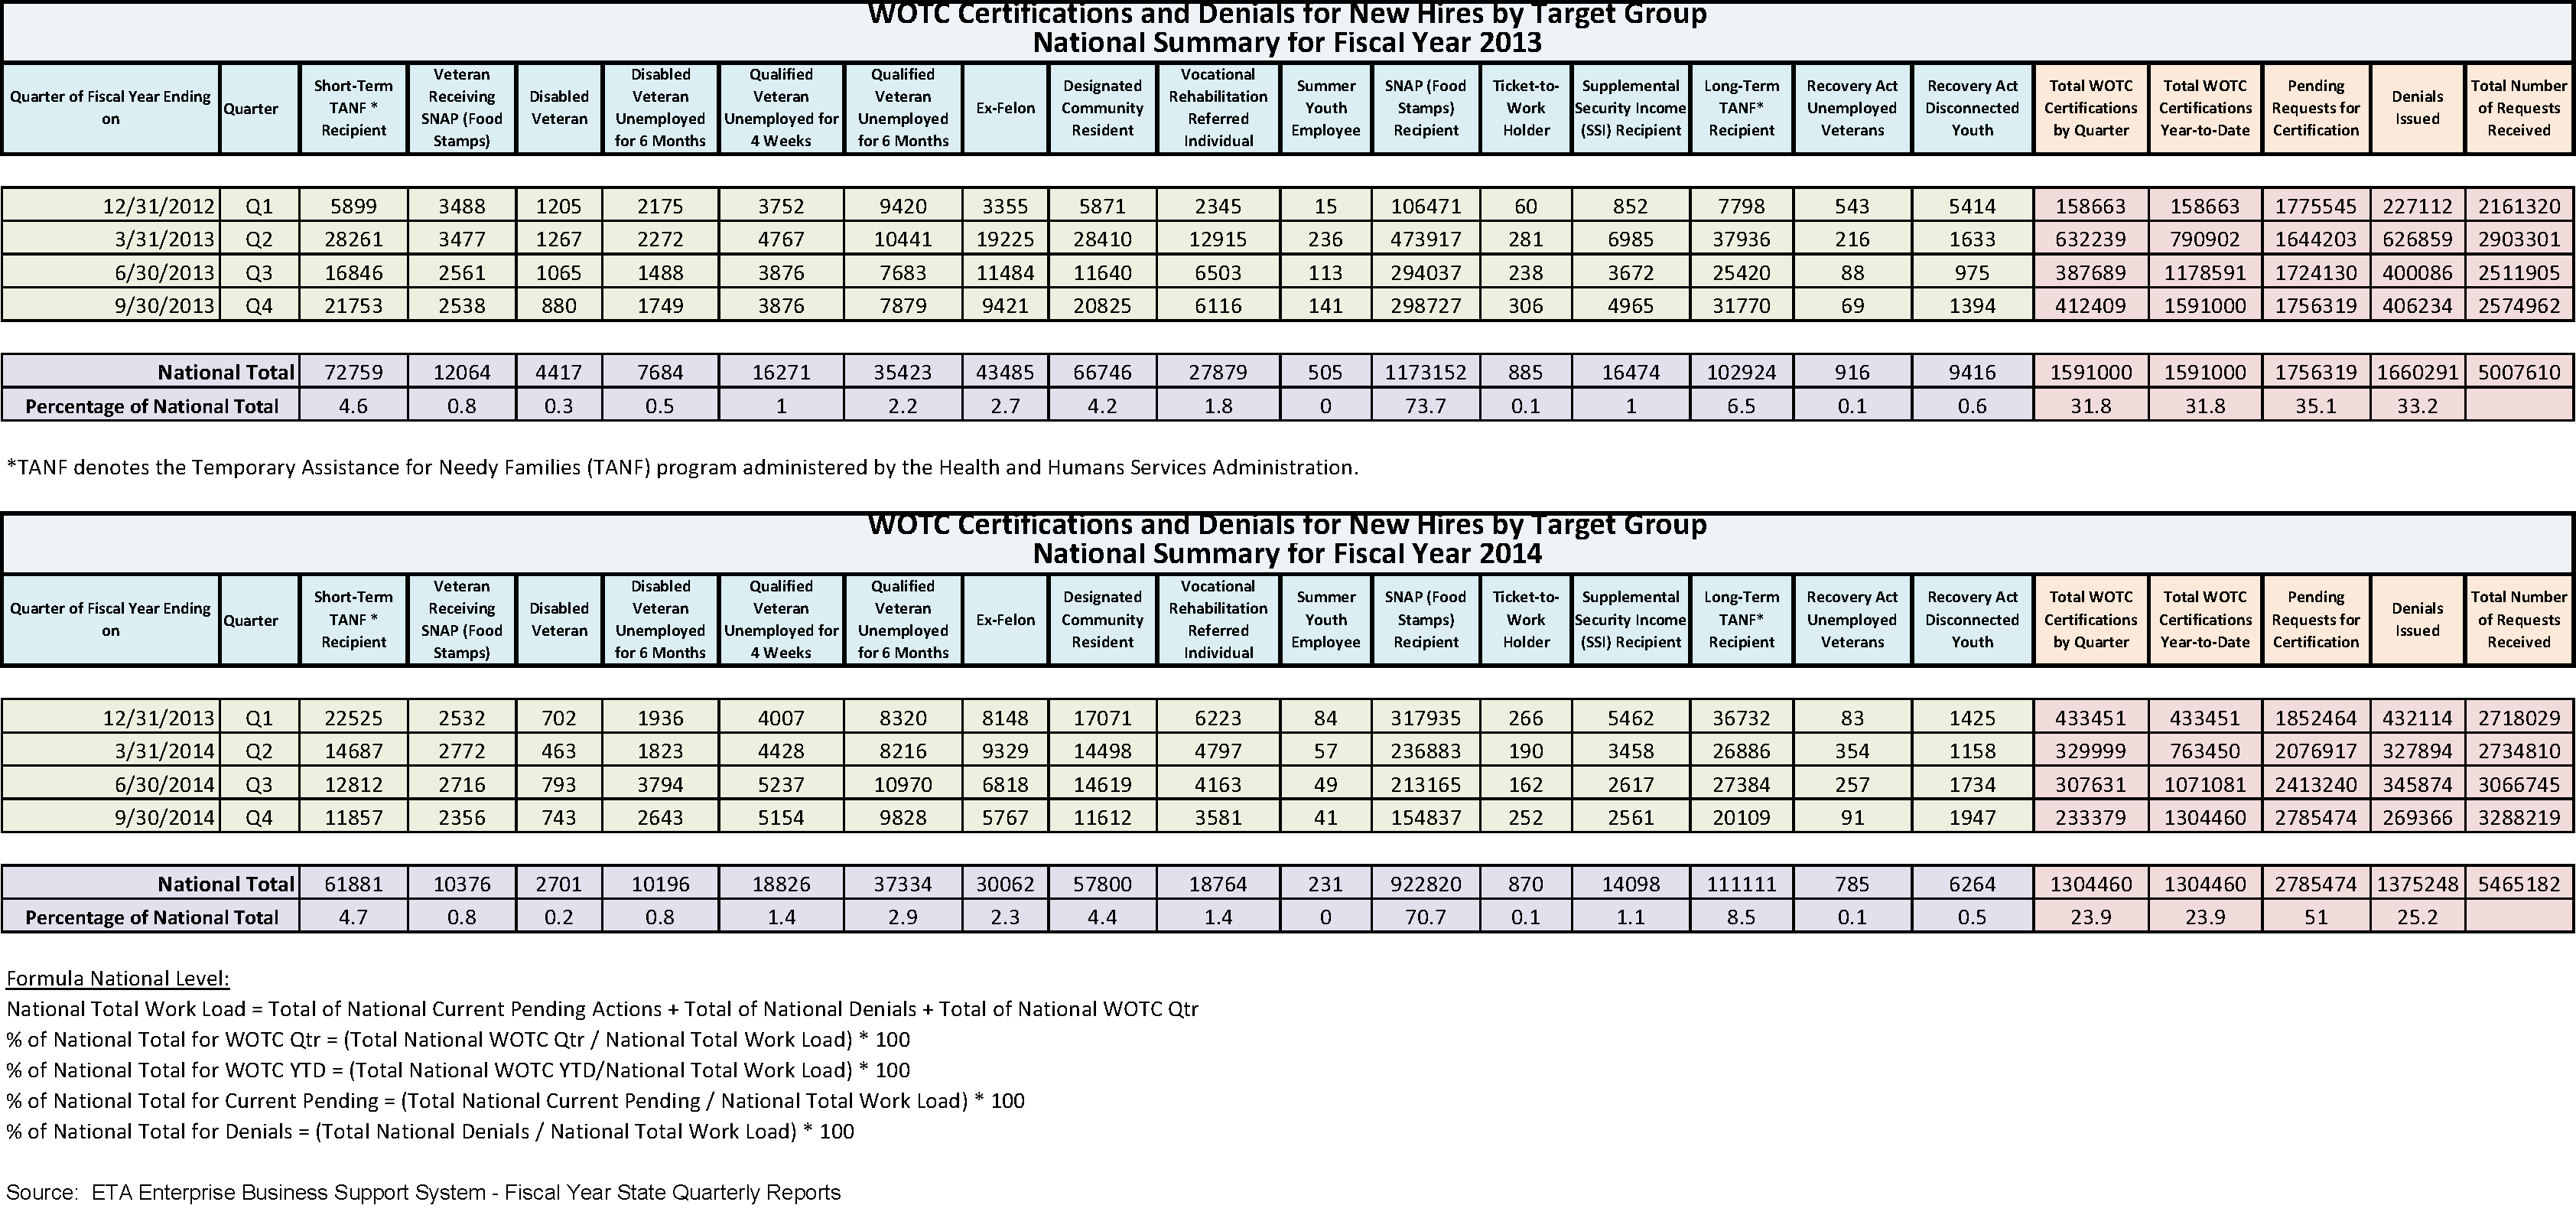
WOTC National Certifications By Target Group Fiscal Years 2013 – 2014 (Click for PDF)
WOTC National Certifications By Target Group Fiscal Years 2002 – 2013
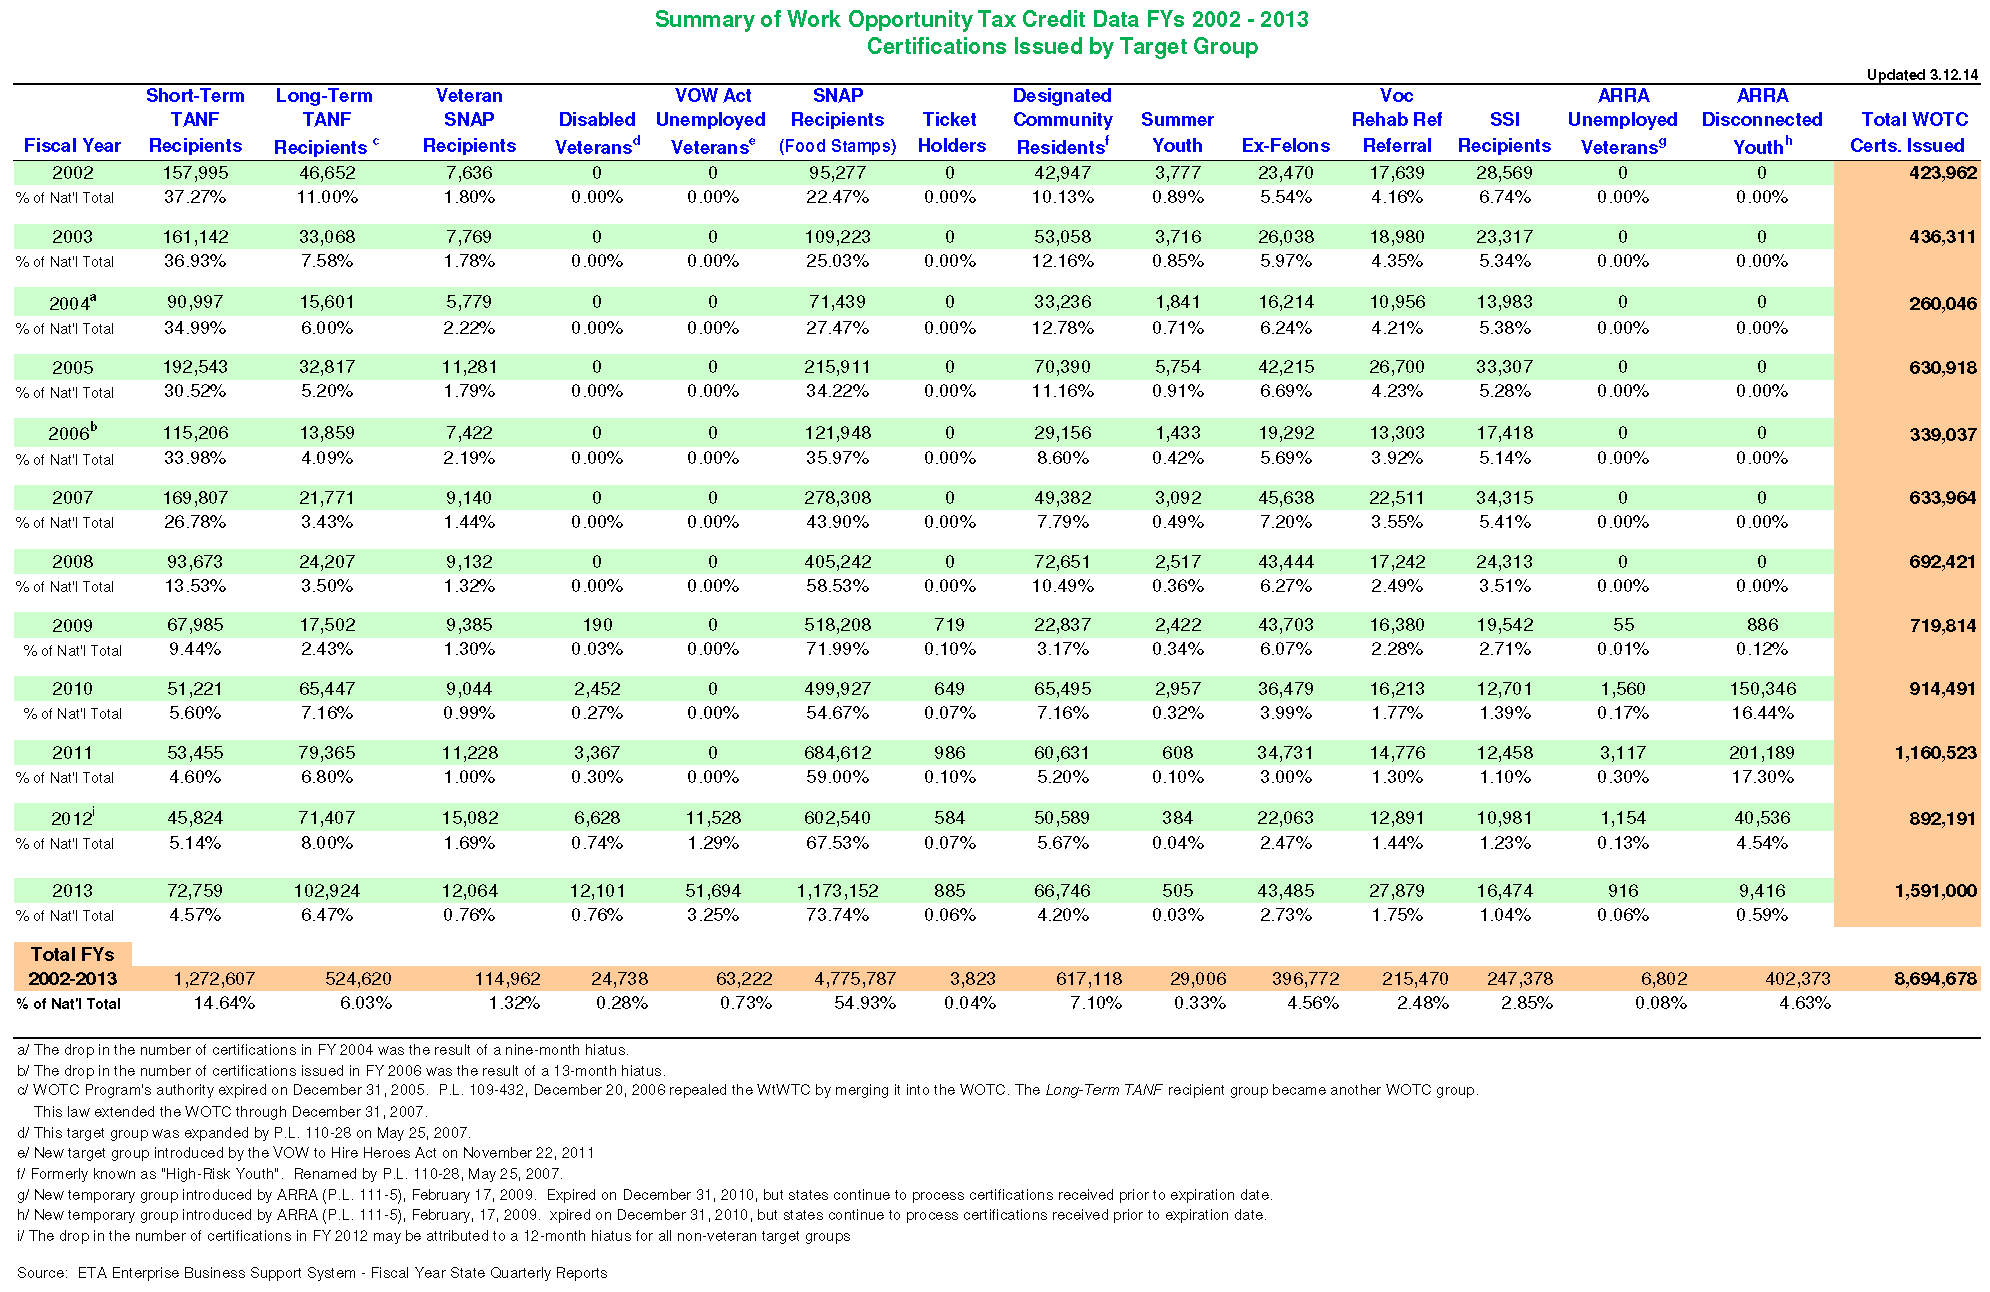
WOTC National Certifications By Target Group Fiscal Years 2002 – 2013 (Click for PDF)
How Much We Save Employers
CMS has worked with WOTC since 1997, and we have found over the years that on average 10-15% of all new employees can fall into one of the tax credit categories that qualify for a tax credit. The average credit received is between $1,500 – $9,600 per qualified new hire depending on the target group. Some of our customers have saved a phenomenal $100,000 in a single year.
How Much Can We Save You?
To find out your potential savings, please see our WOTC Calculator. There’s never been a better time to learn about WOTC. Please contact us at 800-517-9099 to speak to a Work Opportunity Tax Credit expert today.