
MARCH 2023 – Cost Management Services, LLC, a provider of Work Opportunity Tax Credit screening and administration is pleased to announce that the latest statistics for the Work Opportunity Tax Credit from 2022 have recently been released by the U.S. Department of Labor. The data shows that a total of 2,569,646 total Work Opportunity Tax Credits were issued in the United States in 2022.
This represents an almost 23.45% increase over the previous year 2021 (2,081,474 credits), 2020 (1,620,806 credits), 2019 (2,066,616 credits), and 2018 (2,204,142 credits), and shows the continued impact of COVID-19 on the U.S. economy.
The Long-Term Unemployment target group saw a 75.85% increase year over year with 410,015 certifications in 2022 versus 233,160 in 2021. While SNAP, which continues to be the Work Opportunity Tax Credit’s largest category saw a 21.29% increase with 1,563,752 certifications in 2022 versus 1,289,314 in 2021
Although the actual value of the issued tax credits would actually vary based on hours worked, and category the employee came in under, we are using the average tax credit value of $2,400. This would give us a potential total value of 2022’s tax credits at up to an impressive $6.1 Billion.
Click to view the 2022 Work Opportunity Tax Credit Statistics in Detail.
Work Opportunity Tax Credit Statistics By Target Group 2022
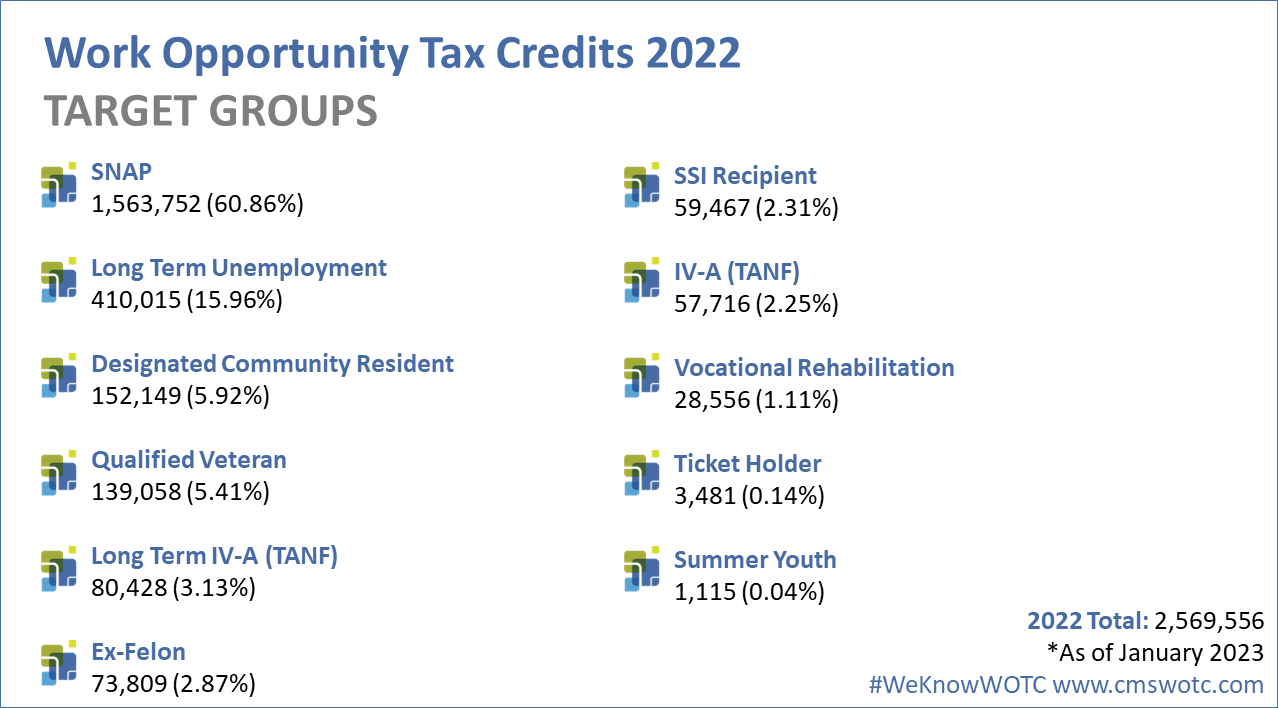
SNAP (food Stamps) continues to be the highest WOTC qualifying target group with 60.86%, the next highest category was Long Term Unemployment saw a 4.76% increase over the previous year, climbing for the second consecutive year.
Since it was introduced in 2017, the Long Term Unemployment category has never reached over 4.67% of the total. Until 2021 that is. At 410,015 certifications, it’s now more than 4 times higher than 2019.
The numbers reflect the state of the labor market at that time. Unemployment was very high from April 2020 to December 2021, peaking at 14.7 million unemployed in April 2020. As of February 2022, unemployment is 5.7 million (Source BLS).
The Qualifying Veteran categories total 5.41% of the total qualifying categories, coming in fourth. The most popular Veteran category was the Veteran unemployed 6 Months (75,553 total) 2.94%. Veteran unemployed 4 Weeks (50,344 total) 1.96%, Veteran Receiving SNAP (10,054 total) 0.39%, Disabled Veteran unemployed 6 Months (2,121 total) 0.08% and Disabled Veteran (986 total) 0.04%.
View WOTC Statistics from 2014-2022 by State/Territory:
About Our WOTC Screening Services
- Why you should use CMS’s WOTC Tax Screening Service rather than doing it yourself.
- Get an idea of how much you could be saving by utilizing the Work Opportunity Tax Credit for your company, try our WOTC Calculator.
- Are you a CPA or tax service provider? Find out how you can become a strategic Business Partner.
Contact Us for More Information or To Get Started Today
In over 25 years of performing WOTC Screening and Administration we’ve saved millions for our customers.
Contact CMS today to start taking advantage. Call 800-517-9099, or contact us below with any questions.